


|
|
slide No. 10 / 15
|
|
|
|
slide No. 10 / 15
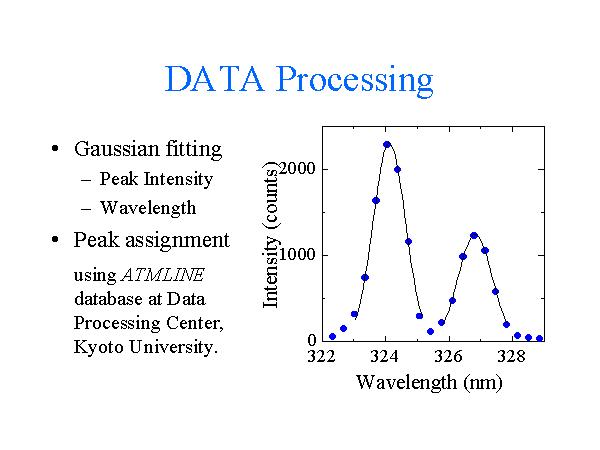
We made a gaussian fitting to the CCD data for 5 to 7 points around the peak, and obtained the peak intensity and the position from the fitting result.
To assign the species of emission lines, we made a comparison the experimental data with ATMLINE, atomic line database at Data Processing Center of Kyoto University.