


|
|
slide No. 12 / 15
|
|
|
|
slide No. 12 / 15
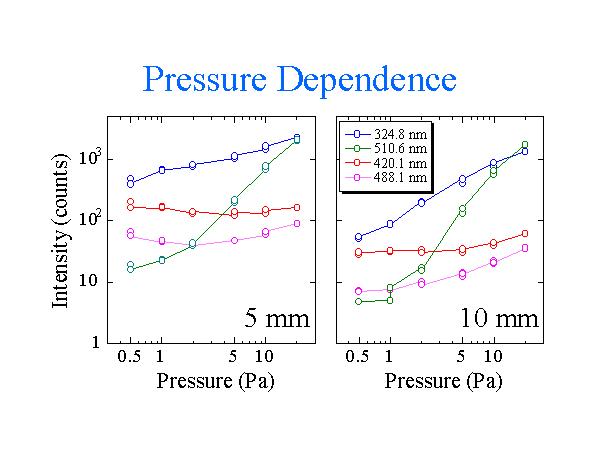
These are the pressure dependence of the emission intensities of those lines described before. Left is the result at 5 mm above the target, while the right is at 10 mm above the target.
In this experiment, the discharge power was kept constant at 100 W. The pressure ranges from 0.5 to 20 Pascals. Both axis is written in log scale. The unit of the vertical axis is A/D converted counts, and the noise level is about 10 or so.
Ar lines are not so strongly dependent on the process pressure, while the intensity of copper lines increase with increase in gas pressure. And the Cu emission from the 510 nanometers increases more rapidly than 324 line.
One more important thing here is, the difference in Cu behavior by the observation positions. While argon lines show same tendency with pressure at both figure, but the 324 increases more steeply at 10 mm, far away from the target.