


|
|
slide No. 10 / 12
|
|
|
|
slide No. 10 / 12
It seems OK, so we combined these two methods, Monte Carlo and BEM, in our simulation program. And we tried some tests.
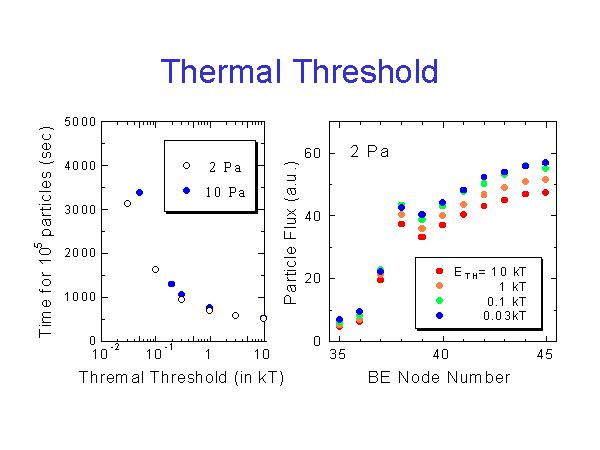
These figures show the behavior of computation time and the calculated thickness profiles, when we change the threshold energy for thermalization of the sputtered particles.
In the right figure, flux of sputtered particles is shown for the boundary nodes around the substrate position. T of kT is a temperature of argon gas. In this calculation, 400 Kelvin.
When threshold energy decreases, flux at the substrate becomes slightly larger. It means that when the energy of Copper atoms are around kT to 10 times kT, copper atoms may still be near the target, and has direction information toward the substrate. As they move away from the target and their energy decreases, this information is lost and the motion of the copper is completely diffusive, random walk like.
The left figure shows the computation times. Horizontal axis is threshold energy in the unit of kT. At 1 kT, the time for 10^5 particles is around 20 minutes or so, and grows rapidly at smaller threshold energies.
We think that 0.1 kT is an appropriate value as of trade-off.